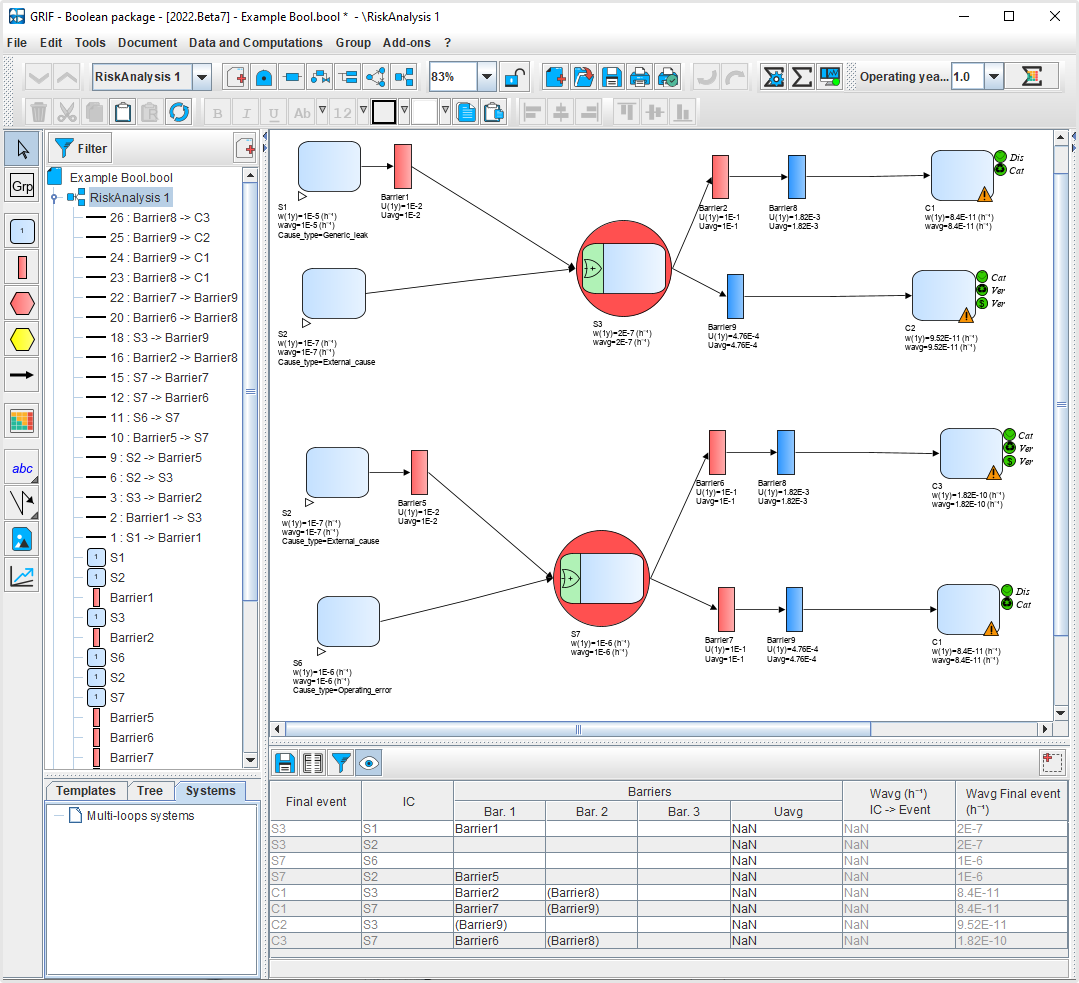
If you are already familiar with the different modules in our Boolean package, you will have no trouble creating models using Bool.

All computation possibilities (probabilities, frequencies, minimal cut sets, importance factors, etc.) in the ALBIZIA engine, are already available in each module in the Boolean package, and are also featured in Bool. The model uses BDD (Binary Decision Diagram) computations to provide accurate results.
Flexibility and level of details
- Depending on the level of accuracy needed, the Bool module allows components to be detailed component (such as a block) using another model (a Fault Tree, for example), which gives users greater flexibility when modelling. They can detail sub- systems if necessary, or keep a more general functional description.
- Comparative sensitivity studies can be performed easily by creating different system architectures and launching the calculations with a specific configuration for each system.

Bow-tie assessment
In the industrial world, probabilistic risk assessments help prevent major accidents and are a two-phase process. First, the unwanted event and its causes are identified, then the sequence of barrier failures is analysed to determine the scenarios. A bow-tie assessment focuses on that issue by identifying all the accidental sequences and quantifying the frequency of occurrence of the unwanted event.

Now that this type of study is gaining ground in risk assessments, the Bool module provides an exact evaluation of the frequency of occurrence of a scenario, without any approximations. Elements common to the different barriers can also be more easily considered thanks to the "repeated object" and "references" settings.
Computations are run on an event tree and presented in the matrix defined by the user, with each scenario (or consequence) positioned according to the results (X-axis) and the severity specified by the user (Y-axis).

All the Boolean module functions are accessible in Bool:
- Input data is summarized in spreadsheet format, making it easy to control the quality of an entry, for example.
- Databases can be connected, to retrieve values and use them as settings.
- Models and curves can be printed as vectors in PDF format.
- Results stored in a single document can be exported in different formats (csv, XML, Excel, etc.).
- Results can be viewed as line graphs, pie charts or histograms.


